 ) to adjust
which columns display and to export data to CSV.
) to adjust
which columns display and to export data to CSV.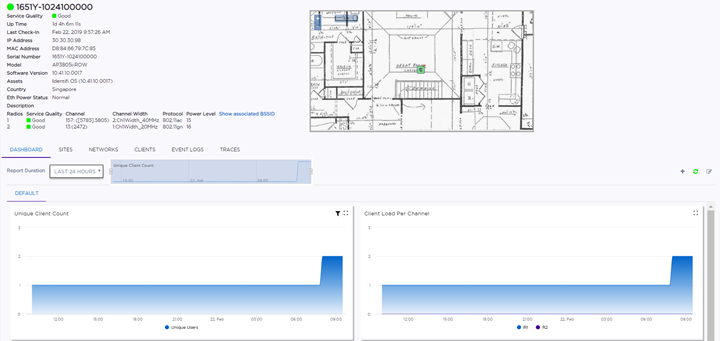
| Sites | View the list of associated sites. Select a site to open the configuration page. |
| Networks | See the list of associated networks. Select a network to open the configuration page. |
| Clients | View a list of associated clients. Select a client to blacklist or whitelist the client. |
| Event Logs | View the list of event logs. Search for
an event or filter the list. Data can be exported using the menu icon (). |
| Traces | View traces. |
Each device has its own dashboard. These entity widgets provide basic information for an individual AP device, including device type, MAC address, serial number, entitlement status, model name, port status, site, and management IP address on the LAN.
 ) icon to configure which widgets display. For example, these
widgets can include the following information:
) icon to configure which widgets display. For example, these
widgets can include the following information:Model-Specific AP Widgets
| Widget Name | Applies To |
|---|---|
| Top App Groups By Throughput Report | ExtremeWireless only |
| Top App Groups By Client Count Report | ExtremeWireless only |
| Top Apps By Throughput Report | ExtremeWireless WiNG only |
| Worst Apps By Throughput Report | ExtremeWireless WiNG only |
| Top Apps By Unique Users | ExtremeWireless WiNG only |
| Smart RF History | ExtremeWireless WiNG only |
| Top APs By Channel Changes | ExtremeWireless WiNG only |
| Top APs By Power Changes | ExtremeWireless WiNG only |
| Top APs By Coverage Hole Changes | ExtremeWireless WiNG only |
| Top Sites By Channel Changes | ExtremeWireless WiNG only |
| Top Sites By Power Changes | ExtremeWireless WiNG only |
| Top Sites By Coverage Hole Changes | ExtremeWireless WiNG only |
| Guest Users Report | ExtremeWireless WiNG only |
| Dwell Time Report | ExtremeWireless WiNG only |
 Print
this page
Print
this page Email this topic
 Feedback
 View PDF
 Download EPUB