You can view and filter on event logs for sites and download legacy logs to see system log information about access points that are assigned to the site and clients. The live log of events on the tenant's network provides detailed insight into incidents and errors that occur on a particular network.
You can customize access and filter on the various criteria to better understand and troubleshoot the network. You can filter on severity, client information (such as 802.11 access and captive portal), and access point information (such as Smart RF and WIPS).
To view event logs for a site:
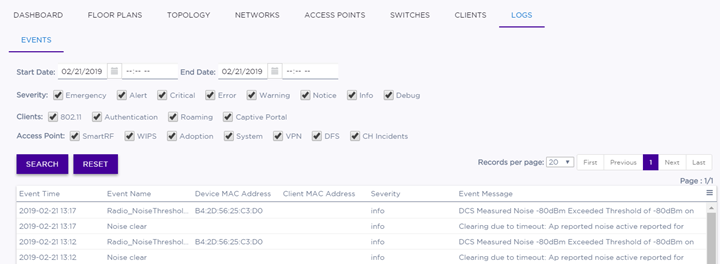
| Severity | (Optional) Select or deselect Severity filters: Emergency, Alert, Critical, Error, Warning, Notice, Info, Debug. |
| Clients | (Optional) Select or deselect Client filters: 802.11, Authentication, Roaming, Captive Portal. |
| Access Point | (Optional) Select or deselect Access Point filters: Smart RF, WIPS, Adoption, System, VPN, DFS, CH Incidents. |
 to
export data and manage which columns display.
to
export data and manage which columns display.
 Print
this page
Print
this page Email this topic
 Feedback
 View PDF
 Download EPUB