The page lists all of the clients in the networks, their status, MAC address, IP address, and other information. Use this information to manage and troubleshoot devices, and blacklist or whitelist clients by MAC address.
Select the menu icon ( ) to see the list of options for the page. You can specify the Refresh option, export some or
all of the data to a CSV file, and configure which data columns display. By default, all
columns display.
) to see the list of options for the page. You can specify the Refresh option, export some or
all of the data to a CSV file, and configure which data columns display. By default, all
columns display.
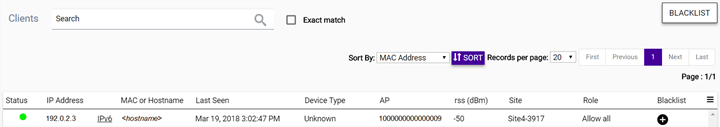
Search for a client using the Search field.
Blacklist a client using either the Blacklist button or selecting the plus icon ( ) next to a
specific client.
) next to a
specific client.
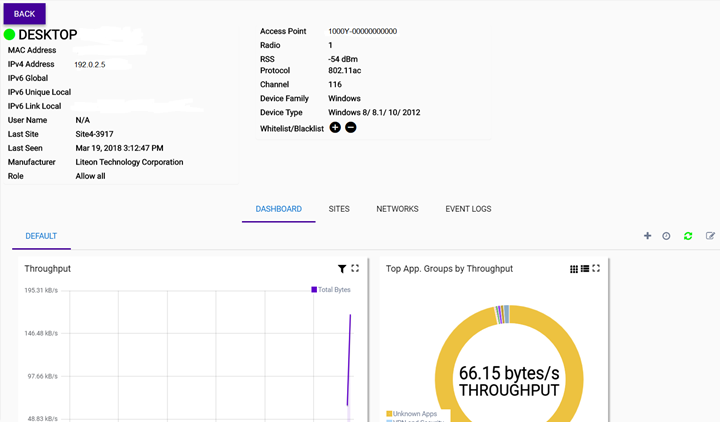
Select a client from the list to open the individual client's Dashboard page and view the statistical details. View or edit the entity dashboard.
Each client has its own dashboard, which can be customized. The widgets can include the following information:
If there is an associated floor plan, it displays in the top right corner. Select the floor plan to access the floor plan tools, such as viewing heat maps.
| Sites | View the list of associated sites. Select a site to open the configuration page. |
| Networks | See the list of associated networks. Select a network to open the configuration page. |
| Event Logs | View the list of event logs. Search for
an event or filter the list. Data can be exported using the menu icon (). |
 Print
this page
Print
this page Email this topic
 Feedback
 View PDF
 Download EPUB