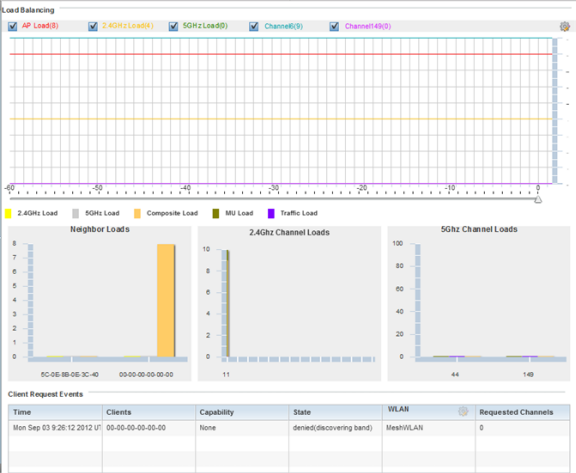
AP Load Balancing
An access point's traffic load can be viewed graphically and filtered to display different load attributes. The access point's entire load can be displayed, as well as the separate loads on the 2.4 and 5 GHz radio bands. Operating channels can also be filtered. Each element can either be displayed individually or collectively in the graph.
To view the access point's load balance in a filtered graph format:
- Select the Statistics menu from the Web UI.
- Expand the System node from the navigation pane (on the left-hand side of the screen). The System node expands to display the RF Domains created within the managed network.
- Expand an RF Domain node, select a controller or service platform, and select one of its connected access points. The access point's statistics menu displays in the right-hand side of the screen, with the Health tab selected by default.
- Select Load
Balancing.The screen is displayed.
 The Load Balancing screen displays the following:
Load Balancing Select any of the options to display any or all of the following information in the graph below: AP Load, 2.4GHz Load, 5GHz Load, and Channel. The graph section displays the load percentages for each of the selected variables over a period of time, which can be altered using the slider below the upper graph.
Client Requests Events The Client Request Events displays the Time, Client, Capability, State, WLAN and Requested Channels for all client request events on the access point. All supported access point models support up to 256 clients per access point.
- Select Refresh to update the screen's statistics counters to their latest values.


