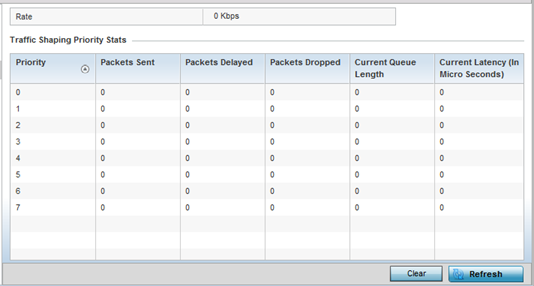
Traffic Shaping - Statistics
To view network the controller or service platform‘s traffic shaping statistics:
- Select the Statistics menu from the Web UI.
- Expand the RF Domain node.
- Select the Wireless Controller node from the left navigation pane.
- Expand the Network menu from the left-hand side of the UI.
- Select Traffic
Shaping.
The Status screen displays by default.
- Select the Statistics tab.The screen displays.
 This screen displays the following information:
Rate The rate configuration controls the maximum traffic rate sent or received on an interface. Consider this form of rate limiting on interfaces at the edge of a network to limit traffic into or out of the network. Traffic within the set limit is sent and traffic exceeding the set limit is dropped or sent with a different priority. Priority Lists the traffic shaper queue priority. There are 8 queues (0 - 7), and traffic is queued in each based on incoming packets 802.1p markings. Packets Sent Provides a baseline of the total number of packets sent to assess packet delays and drops as a result of the filter rules applied in the traffic shaping configuration. Packets Delayed Lists the packets defined as less important than prioritized traffic streams and delayed as a result of traffic shaping filter rules applied. Packets Dropped Lists the packets defined as less important than prioritized traffic streams, delayed and eventually dropped as a result of traffic shaping filter rules applied. Current Length Lists the packet length of the data traffic shaped to meet downstream requirements. Current Latency Traffic shaping latency is the time limit after which packets start dropping as a result of the traffic prioritization filter rules applied. - Select Refresh to update the screen‘s statistics counters to their latest values.


