Debug Wireless Clients
About this task
To troubleshoot issues with wireless client connectivity within a controller, service platform or access point managed RF domain:
Procedure
- Go to Dashboard → System to display managed RF domains.
- Select and expand an RF domain and click on the down arrow to the right of the RF domain‘s name.
- Select Troubleshooting.
-
Select Debug Wireless
Clients.
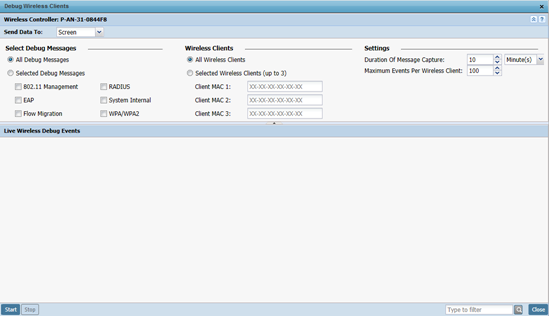
 Debug Wireless Clients Screen
-
Refer to the following remote debug information for RF domain member connected
wireless clients:
RF Domain Displays the administrator assigned name of the selected RF domain used for wireless client debugging. RF domains allow administrators to assign configuration data to multiple devices deployed in a common coverage area, such as in a floor, building, or site. Send Data To Use the Send Data To drop-down menu to select where wireless client debug messages are collected. If Screen is selected, the wireless client debug information is sent to the Live Wireless Debug Events window at the bottom of the dialog window. If File is selected, the file location must be specified in the File Location section of the window. Select Debug Messages Select All Debug Messages to display all wireless client debug information for the selected wireless clients on the current RF domain. Choose Selected Debug Messages to specify which types of wireless client debug messages to display. If the Selected Debug Messages radio button is selected, you can display information for any combination of the following:- 802.11 Management
- EAP
- Flow Migration
- RADIUS
- System Internal
- WPA/WPA2
Wireless Clients Select All Wireless Clients to display debug information for all wireless clients currently associated to the current RF domain. Choose Selected Wireless Clients to display information only for specific wireless clients (between 1 and 3). If Selected Wireless Clients is selected, enter the MAC address for up to three wireless clients. The information displayed or logged to the file will only be from the specified wireless clients. Duration of Message Capture Use the spinner controls to select how long to capture wireless client debug information. This can range between 1 second and 24 hours, with the default value being 1 minute. Maximum Events Per Wireless Client Use the spinner controls to select the maximum number of debug messages displayed per wireless client. Set the number of messages from 1 - 9999 events with the default value being 100 events. File Location When the Send Data To field is set to File, the File Location configuration displays below the configuration section. If Basic is selected, enter the URL in the following format:URL Syntax: tftp://<hostname|IP>[:port]/path/file ftp://<user>:<passwd>@<hostname|IP>[:port]/path/file
IPv6 URL Syntax:
tftp://<hostname|[IPv6]>[:port]/path/file
ftp://<user>:<passwd>@<hostname|[IPv6]>[:port]/path/file
If Advanced is selected, configure the Target, Port, Host/IP, User, Password and optionally the path for the wireless client debug log file you want to create.
Live Wireless Debug Events When the Send Data To field is set to Screen, this area displays live debug information for connected wireless clients in the selected RF domain. -
When all configuration fields are complete, select Start
to start the wireless client debug capture.
If information is being sent to the screen, it displays in the Live Wireless Debug Events section. If the data is being sent to a file, that file populates with remote debug information. If you have set a long message capture duration and want to end the capture early, select Stop.


