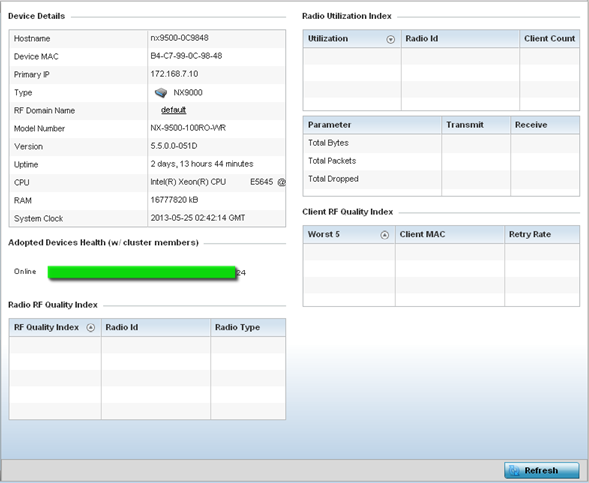
Controller Health
To view health data:
- Select the Statistics tab from the Web UI.
- Select System from the navigation pane (on the left-hand side of the screen).
- Expand the RF Domain node, and select one its connected Wireless Controller/Service Platform.
- Select Health from the
left-hand side of the UI.

Review the different fields displayed on the screen.
The Device Details field displays the following:Hostname Displays the hostname of the controller or service platform. Device MAC Displays the MAC address of the controller or service platform. Primary IP Lists the network address used by this controller or service platform as a network identifier. Type Displays the controller type (for example, service platform type NX9600). RF Domain Name Displays the controller's domain membership. The name displays in the form of a link that can be selected to display a detailed description of the RF Domain configuration. Model Number Displays the model number of the selected controller or service platform. Version Displays the version of the image running on the controller or service platform. Uptime Displays the cumulative time since the controller or service platform was last rebooted or lost power. CPU Displays the controller or service platform processor name. RAM Displays the CPU memory currently utilized. System Clock Displays the system clock information. The Adopted Devices Health (w/ cluster members) chart shows how many managed devices are online versus offline. These cluster members directly managed by the wireless controller or service platform. This data does not include access points associated to other controllers or service platforms in the same cluster.
The Radio RF Quality Index field displays RF quality (overall effectiveness of the RF environment). Use this table to assess radio performance for improvement ideas. This field displays the following:RF Quality Index Displays the five radios with the lowest average quality. Radio id Displays a radio‘s hardware encoded MAC address The ID appears as a link that can be selected to show radio utilization in greater detail. Radio Type Identifies whether the radio is a 2.4 or 5 GHz. The Radio Utilization field measures how efficiently the traffic medium is used. It‘s defined as the percentage of the current throughput relative to the maximum relative possible throughput:Total Bytes Displays the total bytes of data transmitted and received by the controller or service platform since the screen was last refreshed. Total Packets Lists the total number of data packets transmitted and received by the controller or service platform since the screen was last refreshed. Total Dropped List the number of dropped data packets by a controller or service platform managed access point radio since the screen was last refreshed. The Client RF Quality Index field displays the RF quality of the clients. Use this table to troubleshoot radios not optimally performing:Worst 5 Displays five client radios with the lowest quality indices of all of those managed by the controller or service platform. Client MAC Displays the hardware encoded MAC address of the client. Retry Rate Displays the excessive retry rate of each listed controller or service platform client. - Select Refresh to update the statistics counters to their latest values.


