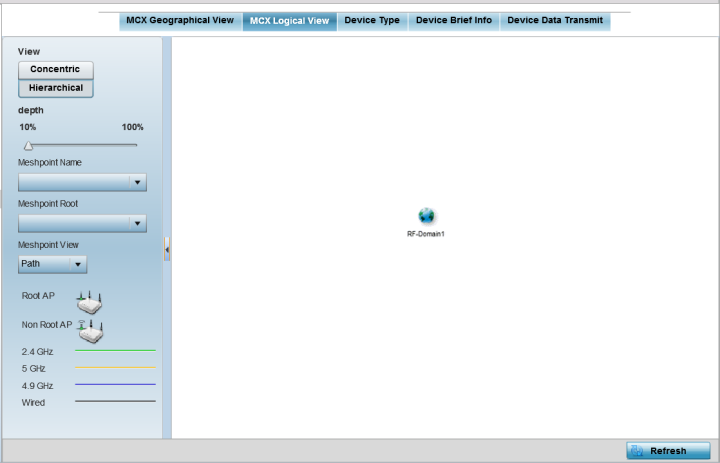
MCX Logical View
The MCX Logical View screen provides a logical representation of mesh point statistics.
- Select the Statistics menu from the Web UI.
- Expand the System node on the top, left-hand side of the screen.
The System node expands to display the RF Domains created within the managed network.
- Select an RF Domain from the list.
The RF Domain statistics menu displays in the right-hand side of the screen, with the Health tab selected by default.
- Select Mesh
Point from the RF Domain menu.
The MCX Geographical View screen displays by default.
- Click MCX Logical
View.
The MCX Logical View screen displays.

This screen has two panes. The left-hand pane provides filter options to help you define the display format. The right-hand pane displays mesh statistics based on the filters specified by you in the left-hand pane.
In the left-hand pane:
- Specify the View format as Concentric or
Hierarchical .
The Concentric view displays the mesh as a concentric arrangement of devices, with the mesh's root node at the centre and the other mesh devices arranged in circles around it.
The Hierarchical view displays the mesh's root node at the top of the mesh tree, and the relationship of the mesh nodes are displayed as such.
- Use the Meshpoint Name drop-down menu to select the mesh point. The graphical representation of the selected mesh point is displayed in the right-hand view area.
- Use the Meshpoint Root drop-down to select the mesh root. Or, select All Roots.
- To further refine the display, use the Meshpoint View drop-down menu to specify the view type as either Path or Neighbor.
- Periodically click Refresh to update the status of the screen.


