Inventory
The Inventory screen displays information about the physical hardware managed within the system by its member controller or service platforms. Use this information to assess the overall performance of wireless devices.
To display the inventory statistics:
- Select Inventory
from the left-hand side of the UI.

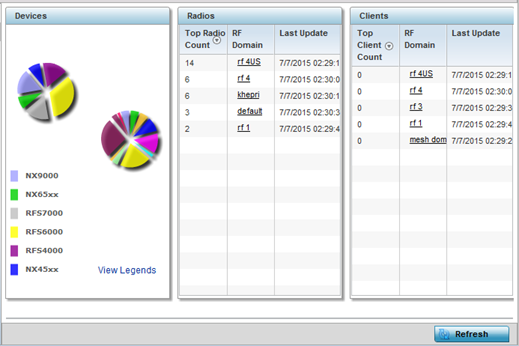
- The Devices table displays an exploded pie chart depicting the controller, service platform and access point device type distribution by model. The device on the left displays managing controller models. Select View Legends to assess connected access points. Use this information to assess whether these are the correct models for the system's deployment objective.
- The Radios table displays radios deployed within the
wireless
controller or service platform managed network. This area displays the total
number of managed radios and the top 5 RF Domains in terms of
radio count. The Total
Radios value is the total number of radios in this
system.
Top Radio Displays the radio index for each listed top performing radio. RF Domain Displays the name of the RF Domain where the listed radios reside as device members. The RF Domain displays as a link that can be selected to display specific RF Domain member radio configuration information in greater detail. Last Update Displays the UTC time stamp when each listed radio was last reported. - The Clients table displays the total number of
wireless clients managed by the wireless
controller or service platform. This Top Client Count table lists the top 5 RF
Domains, in terms of the number of wireless clients
adopted:
Top Client Displays the client index of each listed top performing client. RF Domain Displays the name of the client RF Domain. Last Update Displays the UTC timestamps when the client count was last reported. - Select Refresh to update the statistics counters to their latest values.


