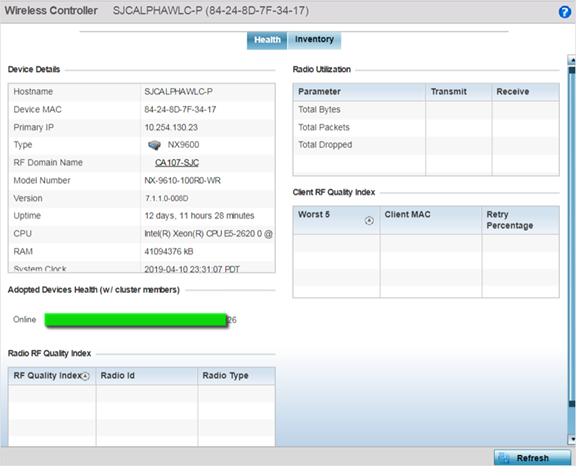
Controller Health
To assess the controller‘s network health:
- Go to .
- Select and expand an RF domain to expose its member controllers.
- Select a controller. The Health tab displays
by default.Wireless Controller Dashboard - Health Tab

Refer to the following to assess the overall health of the controller:
- The Device Details table
provides the following information:
- Hostname - Lists the administrator assigned name of the controller.
- Device MAC - Lists the factory encoded MAC address of the controller.
- Type - Indicates the type of controller. An icon representing the NX service platform device type is displayed along with the model number.
- RF Domain Name - Lists the RF domain to which the controller belongs. The RF Domain displays as a link that‘s selectable to display RF Domain data in greater detail.
- Model Number - Lists the model number and hardware SKU information of the selected controller to refine its intended deployment region.
- Version - Lists the firmware version currently running on the controller. Compare this version against the version currently on the support site to ensure the controller has the latest feature set available.
- Uptime - Displays the duration the controller has been running since it was last restarted.
- CPU - Displays the CPU installed on this controller.
- RAM - Displays the amount of RAM available for use in this system.
- System Clock - Displays the current time set on the controller.
- The Adopted Devices Health (w/ cluster members) field displays a graph of access points in the system with the available access points in green and unavailable access points in red.
- The Radio RF Quality
Index table provides a table of RF quality on a per radio basis. It
is a measure of the overall effectiveness of the RF environment displayed in
percentage. It is a function of the connect rate in both directions, the retry
rate and the error rate. The screen displays the average quality index within the
access point single radio. The table lists the bottom five (5) of the RF quality
values by access point radio. The quality is measured as:
- 0-20 - Very poor quality
- 20-40 - Poor quality
- 40-60 - Average quality
- 60-100 - Good quality

Note
Select a Radio Id to view statistics in greater detail. - The Radio Utilization table displays how efficiently the RF medium is used. Radio utilization is defined as the percentage of current throughput relative to the maximum possible throughput for the radio. Use this table to assess access point radios in terms of the number of associated wireless clients and the percentage of utilization. It also displays a table of packets types transmitted and received.
- The Client RF Quality
Index table displays a table of RF quality on a per client basis. It
is a measure of the overall effectiveness of the RF environment displayed in
percentage. It is a function of the connect rate in both directions, the retry
rate and the error rate. This area of the screen displays the average quality
index for a client. The table lists the bottom five (5) of the RF quality values
by a client. Quality is measured as:
- 0-20 - Very poor quality
- 20-40 - Poor quality
- 40-60 - Average quality
- 60-100 - Good quality

Note
Select a Client MAC to view all the statistics for the selected client in greater detail.


