Collection Engine Status
You can view a report on the connection status between the Analysis Engine and the remote data collector engine on each controller.
To View the Collection Engine Status:
- From the top menu, click Reports.
- In the left
pane, under Radar, click
Collection Engine Status.
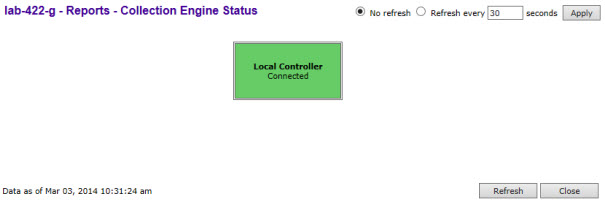
The boxes display the IP address of the Data Collector engine. The status of the Data Collector engine is indicated by one of the following colors:
- Green — The Analysis Engine has connection with the Data
Collector on that controller.
- Yellow — The Analysis Engine has connected to the Data
Collector but has not synchronized with it. Ensure that the Data Collector is running
on the remote controller.
- Red — The Analysis Engine is aware of the Data Collector
and attempting to connect.
If no box is displayed, the Analysis Engine is not attempting to connect with that Data Collector Engine.

Note
If the box
is displayed red and remains red, ensure your IP address is correctly set up to point to
an active controller. If the box remains yellow, ensure the Data Collector is running on
the remote controller.
- To modify the page‘s refresh rate, type a time (in seconds) in the Refresh every __ seconds box at the top of the screen and click Apply. The new refresh rate is applied.
- To refresh the page, click Refresh.
- To close the report window, click Close.
 Print
this page
Print
this page Email this topic
 Feedback
 View PDF
 Download EPUB