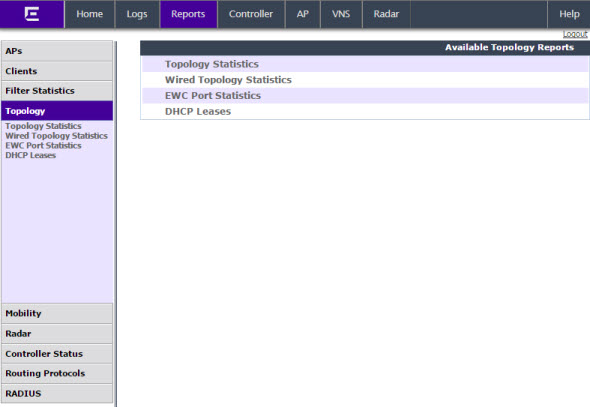
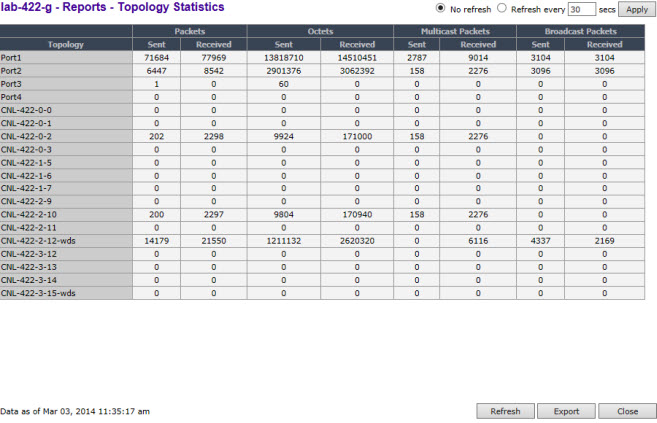
Topology Statistics — Displays statistics for total sent and received packets, octects, multicast packets, and broadcast packets.
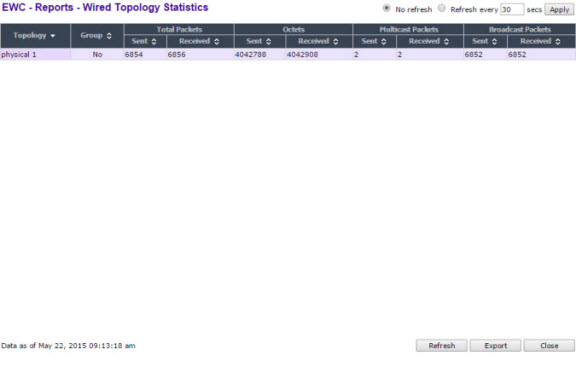
Wired Topology Statistics — Displays statistics for each topology including total packets sent and received.
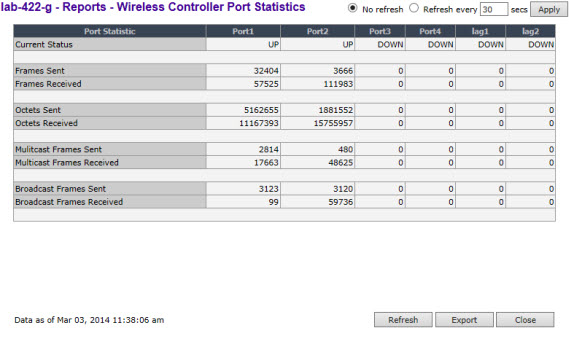
EWC Port Statistics — Displays port statistics for active Topologies including current status and totals for frames, octects, multicast frames and broadcast frames sent and received.
DHCP Leases — Displays statistics to help determine if you have sufficient DHCP (Dynamic Host Configuration Protocol) addresses for your needs and whether the lease times are too long.
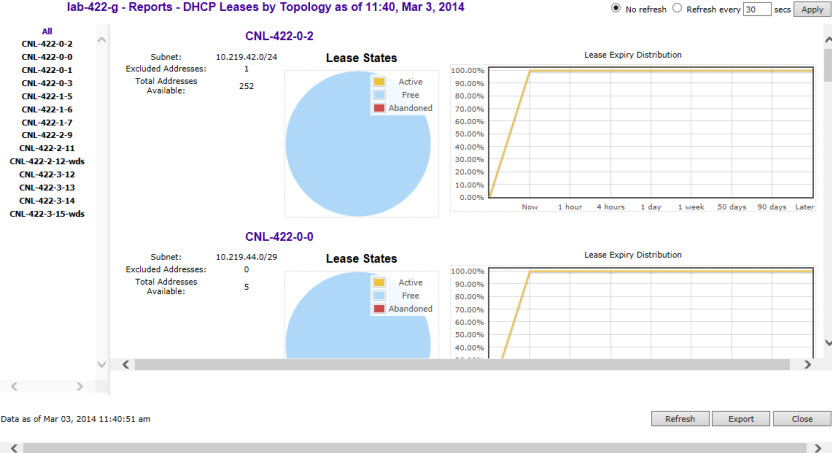
The report applies only to the DHCP server hosted on the local controller. The report is empty if DHCP is not enabled on any of the controller‘s topologies. Otherwise, for each of the controller‘s topologies the report provides a summary table of the address range, number of excluded address and total addresses available, a pie chart showing the proportion of addresses that are free, in use or abandoned, and a graph that shows how many leases will become available at different times assuming that no more leases are handed out by the server from this instant.
Abandoned leases should rarely be seen. The presence of one or more abandoned leases indicates that another DHCP server may be operating on the same subnet, resulting in IP address conflicts. The server abandons the use of any address it thinks is being managed by another DHCP server.
The lease expiry graph indicates the proportion of available leases that will be available now, 1, 4 hours, 1 day, 1 week 50 and 90 days from now assuming that the server never hands out another lease. If the network serves a relatively small number of users, who are in fact the same users day in and day out, then you should use longer lease times, meaning that this graph should not show 100% address availability until farther to the right in the graph. If you have a high turn over of users (like in a university classroom that has a different set of people every 1 hour) then you should use shorter lease times (achieve 100% availability more towards the left in the graph). If you find that you are running out of addresses, you should use the line graph to decide if you can afford to shorten lease times to make leases available sooner as opposed to creating a new, bigger subnet to handle more users concurrently.
 Print
this page
Print
this page Email this topic
 Feedback
 View PDF
 Download EPUB