AP Firewall Packet Flows
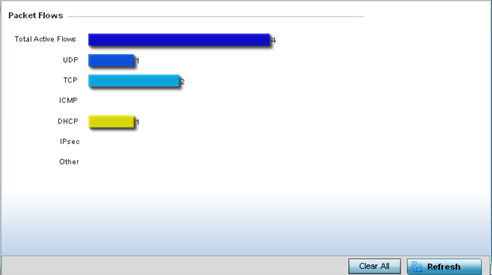
The Packet Flows screen displays data traffic
packet flow utilization. The chart represents the different protocol flows supported,
and displays a proportional view of the flows in respect to their percentage of data
traffic utilized.
The Total Active Flows graph displays the total
number of flows supported. Other bar graphs display for each individual packet type.
To view access point packet flows statistics:
- Select the Statistics menu from the Web UI.
- Expand the System
node from the navigation pane (on the left-hand side of the screen). The
System node expands to display the RF Domains created within the managed
network.
- Expand an RF Domain node, and select one of
it's connected access points. The access point's statistics menu displays in the
right-hand side of the screen, with the Health tab selected by
default.
- Expand the Firewall menu.
The screen displays by default in the right-Hand pane.
- Select Clear
All to revert the statistics counters to zero and begin a new data
collection, or select Refresh to update the display to the latest values.
 Print
this page
Print
this page Email this topic
 Feedback
 View PDF
 Download EPUB