Refer to the Traffic Statistics screen to review access point radio transmit and receive statistics, data rate and dropped packets during both transmit and receive operations.
To view the access point radio traffic statistics:
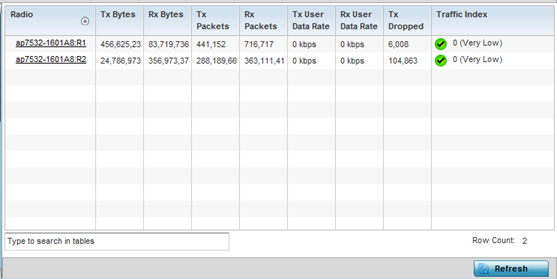
| Radio |
Displays the name assigned to the radio as its unique identifier. The name displays in the form of a link that can be selected to launch a detailed screen containing radio throughout data. |
| Tx Bytes |
Displays the total number of bytes transmitted by each listed radio. This includes all user data as well as any management overhead data. |
| Rx Bytes |
Displays the total number of bytes received by each listed radio. This includes all user data as well as any management overhead data. |
| Tx Packets |
Displays the total number of packets transmitted by each listed radio. This includes all user data as well as any management overhead packets. |
| Rx Packets |
Displays the total number of packets received by each listed radio. This includes all user data as well as any management overhead packets. |
| Tx User Data Rate |
Displays the rate (in kbps) user data is transmitted by each listed radio. This rate only applies to user data and does not include management overhead. |
| Rx User Data Rate |
Displays the rate (in kbps) user data is received by the radio. This rate only applies to user data and does not include management overhead. |
| Tx Dropped |
Displays the total number of transmitted packets dropped by each listed radio. This includes all user data as well as management overhead packets that were dropped. |
| Error Rate |
Displays the total number of received packets which contained errors for the listed radio. |
 Print
this page
Print
this page Email this topic
 Feedback
 View PDF
 Download EPUB