Individual events can be assessed for impact and administered based on their recency and severity. Review events and, if necessary, update the manner in which they're displayed.
To review diagnostic events:
Select .
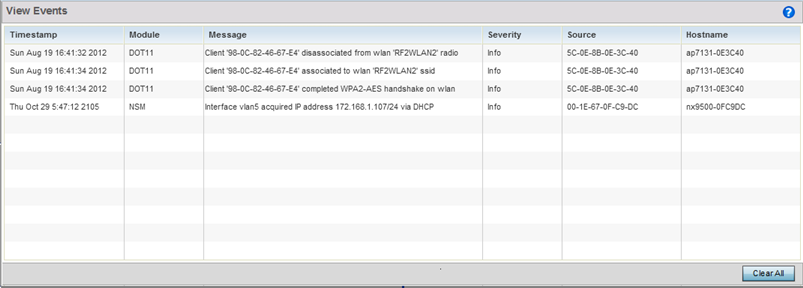
Use the View Events screen to track and troubleshoot events using the source and severity levels defined in the configure events screen.
Refer to the following event parameters to assess nature and severity of the displayed:
|
Timestamp |
Displays the Timestamp (time zone specific) when the fault occurred. |
|
Module |
Displays the module used to track the event. Events detected by other module are not tracked. |
|
Message |
Displays error or status messages for each event listed. |
|
Severity |
Displays the severity of the event as defined for tracking from the Configuration screen. Severity options include: All Severities – All events are displayed irrespective of their severity Critical – Only critical events are displayed Error – Only errors and above are displayed Warning – Only warnings and above are displayed Informational – Only informational and above events are displayed |
|
Source |
Displays the MAC address of the source device tracked by the selected module. |
|
Hostname |
Displays the Hostname/IP address of the source device tracked by the selected module. |
Select Clear Allto clear the events displayed on this screen and begin a new event data collection.
 Print
this page
Print
this page Email this topic
 Feedback
 View PDF
 Download EPUB