The Inventory tab displays information on the devices managed by RF domain member devices in the controller, service platform or access point managed network. The Inventory screen enables an administrator to overview of the number and state of the devices in the selected RF domain. Information is displayed in easy to read tables and graphs.
To review the RF domain inventory:
The RF Domain Inventory screen displays.
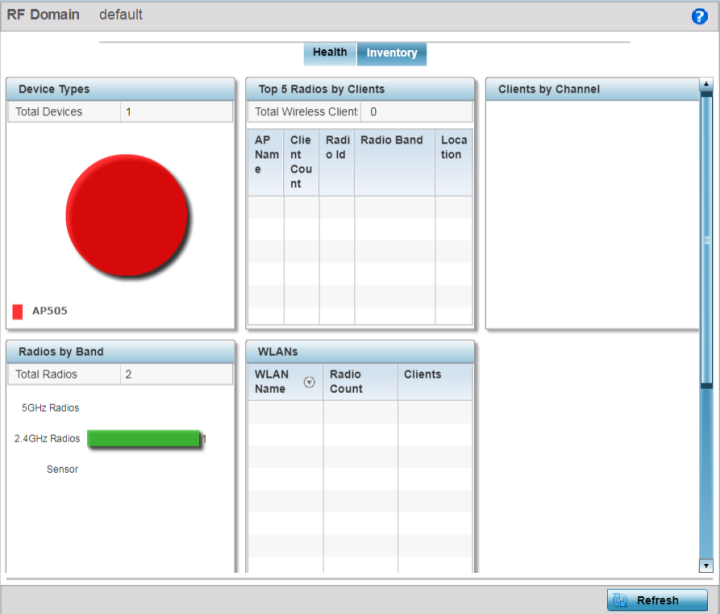
The Device Types table displays the devices types populating the RF domain. The Device Type area displays an exploded pie chart that displays the type of device and their numbers in the RF domain.
The Radios by Band table displays a bar graph of RF domain member device radios classified by their radio band or sensor dedication. Review this information to assess whether RF domain member radios adequately support client device traffic requirements.
The Radios by Channel table displays pie charts of the different channels utilized by RF domain member radios. These dedicated channels should be as segregated as possible from one another to avoid interference. If too many radios are utilizing a single channel, consider off-loading radios to non utilized channels to improve RF domain performance.
The Top 5 Radios by Clients table displays a list of radios that have the highest number of clients. This list displays the radio IDs as links that can be selected to display individual radio information in greater detail.
The WLANs table displays a list of WLANs utilized by RF domain member devices. The table is ordered by WLAN member device radio count and their number of connected clients. Use this information to assess whether the WLAN is overly populated by radios and clients contributing to congestion.
The Clients by Band table displays the radio band utilization of connected RF domain member clients. Assess whether the client band utilization adequately supports the intended radio deployment objectives of the connected RF domain member access point radios.
The Clients by Channels table displays a bar-graph of wireless clients classified by their frequency. Information for each channel is further classified by their 802.11x band. In the 5GHz channel, information is displayed classified under 802.11a and 802.11an bands. In the 2.4 GHz channel, information is displayed classified under 802.11b, 802.11bg, and 802.11bgn band.
 Print
this page
Print
this page Email this topic
 Feedback
 View PDF
 Download EPUB