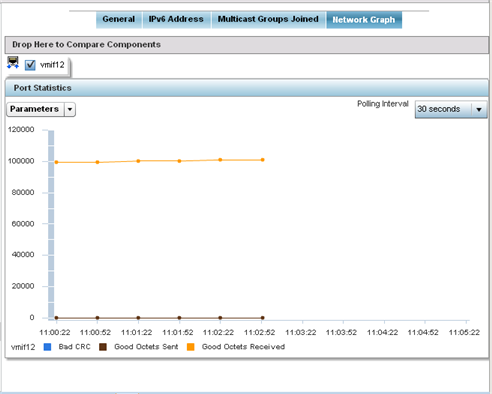
The Network Graph displays statistics the access point continuously collects for its interfaces. Even when the interface statistics graph is closed, data is still collected. Display the interface statistics graph periodically for assessing the latest interface information. Up to three different stats can be selected and displayed within the graph.
To view a detailed graph for an interface, select an interface and drop it on to the graph. The graph displays Port Statistics as the Y-axis and the Polling Interval as the X-axis. Use the Polling Interval from-down menu to define the increment data is displayed on the graph.
To view the Interface Statistics graph:
 Print
this page
Print
this page Email this topic
 Feedback
 View PDF
 Download EPUB