The Traffic screen provides an overview of client traffic utilization in both the transmit and receive directions. This screen also displays a RF quality index.
To view the traffic statistics of a wireless clients:
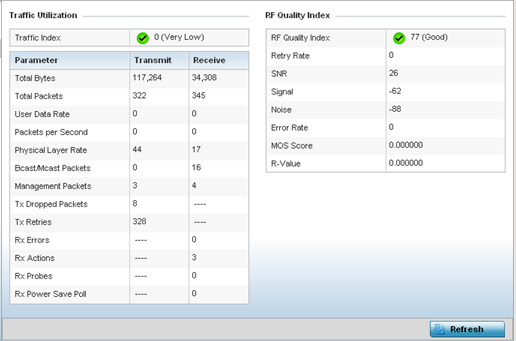
| Total Bytes |
Displays the total bytes processed (in both directions) by the access point‘s connected client. |
| Total Packets |
Displays the total number of data packets processed (in both directions) by the access point‘s connected wireless client. |
| User Data Rate |
Displays the average user data rate. |
| Packets per Second |
Displays the packets processed per second. |
| Physical Layer Rate |
Displays the data rate at the physical layer level. |
| Bcast/Mcast Packets |
Displays the total number of broadcast/management packets processed by the client. |
| Management Packets |
Displays the number of management (overhead) packets processed by the client. |
| Tx Dropped Packets |
Displays the client's number of dropped packets while transmitting to its connected access point. |
| Tx Retries |
Displays the total number of client transmit retries with its connected access point. |
| Rx Errors |
Displays the errors encountered by the client during data transmission. The higher the error rate, the less reliable the connection or data transfer between client and connected access point. |
| Rx Actions |
Displays the number of receive actions during data transmission with the client's connected access point. |
| Rx Probes |
Displays the number of probes sent. A probe is a program or other device inserted at a key juncture in a for network for the purpose of monitoring or collecting data about network activity. |
| Rx Power Save Poll |
Displays the power save using the PSP (Power Save Poll ) mode. Power Save Poll is a protocol, which helps to reduce the amount of time a radio needs to powered. PSP allows the WiFi adapter to notify the access point when the radio is powered down. The access point holds any network packet to be sent to this radio. |
| RF Quality Index |
Displays information on the RF quality of the
selected wireless client. The RF quality index is the overall
effectiveness of the RF environment as a percentage of the
connect rate in both directions as well as the retry rate and
the error rate. The RF quality index value can be interpreted
as:
|
| Retry Rate |
Displays the average number of retries per packet. A high number indicates possible network or hardware problems. |
| SNR (dBm) |
Displays the connected client's SNR. A high SNR could warrant a different access point connection to improve performance. |
| Signal (dBm) |
Displays the power of the radio signals in - dBm. |
| Noise (dBm) |
Displays the disturbing influences on the signal in - dBm. |
| Error Rate (ppm) |
Displays the number of received bit rates altered due to noise, interference and distortion. It is a unit-less performance measure. |
| MOS Score |
Displays average voice call quality using the MOS (Mean Opinion Score ) call quality scale. The MOS scale rates call quality on a scale of 1-5, with higher scores being better. If the MOS score is lower than 3.5, it's likely users will not be satisfied with the voice quality of their call. |
| R-Value |
R-value is a number or score used to quantitatively express the quality of speech in communications systems. This is used in digital networks that carry VoIP (Voice over IP ) traffic. The R-value can range from 1 (worst) to 100 (best) and is based on the percentage of users who are satisfied with the quality of a test voice signal after it has passed through a network from a source (transmitter) to a destination (receiver). The R-value scoring method accurately portrays the effects of packet loss and delays in digital networks carrying voice signals. |
 Print
this page
Print
this page Email this topic
 Feedback
 View PDF
 Download EPUB