AP Temperature Sensor
To view an AP 8132 model
access point‘s environmental temperature:
- Select the Statistics menu from the Web UI.
- Expand the System
node from the navigation pane (on the left-hand side of the screen). The
System node expands to display the RF Domains created within the managed
network.
- Expand an RF Domain node, and select one of
it's connected access points. The access point's statistics menu displays in the
right-hand side of the screen, with the Health tab selected by
default.
- Expand the Environment menu.
- Select the Temperature tab.
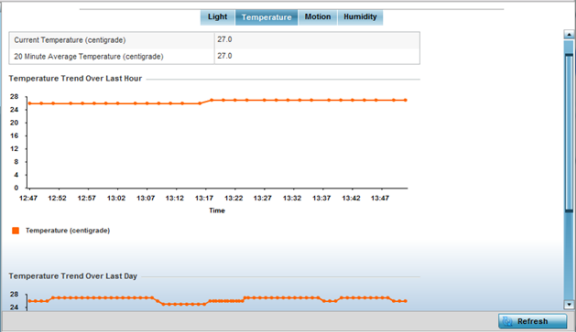
The
Statistics > AP 8132 > Environment > Temperature tab
displays.
- Refer to the Temperature table to assess
the sensor's detected temperature within the AP 8132‘s
immediate deployment area.
Temperature is measured in
centigrade. The table displays the Current Temperature
(centigrade) and the 20 Minute Average Temperature
(centigrade). Compare these two items to determine whether the AP 8132‘s deployment location remains consistently heated.
- Refer to the Temperature Trend Over Last Hour
graph to assess the fluctuation in ambient temperature over the last hour.
Use this graph in combination with the Light and Motions graphs (in particular) to
assess the deployment area‘s activity level.
- Refer to the Temperature Trend Over Last
Day graph to assess whether deployment area temperature is consistent
across specific hours of the day. Use this information to help determine whether the
AP 8132
can be upgraded or powered off during specific hours of the day.
- Select Refresh at any time to update the
screen‘s statistics counters to their latest values.
 Print
this page
Print
this page Email this topic
 Feedback
 View PDF
 Download EPUB