The Health screen displays general status information for a selected RF Domain, including data polled from all its members.
To display the collective device membership health of a controller, service platform or AP RF Domain:
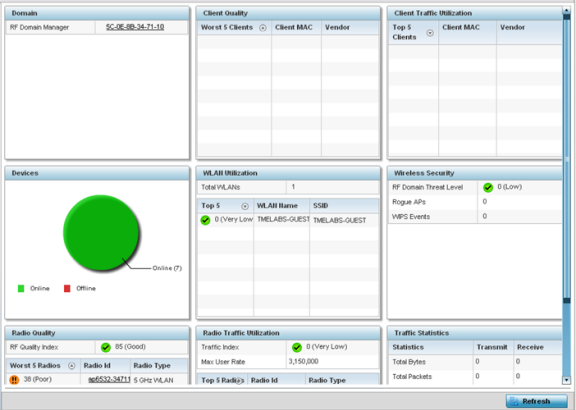
The RF Domain statistics menu displays in the right-hand side of the screen, with the Health tab selected by default.
Refer to the Radio Quality table for RF Domain member radios requiring administration to improve performance:
| Worst 5 Radios | Displays five radios with the lowest average quality in the RF Domain. |
| Radio ID | Lists each radio‘s administrator defined hostname and its radio designation (radio 1, radio 2 or radio 3). |
| Radio Type | Displays the radio type as either 5 GHz or 2.4 GHz. |
| Worst 5 Clients | Displays the five clients having the lowest average quality indices. |
| Client MAC | Displays the hard coded radio MAC of the wireless client. |
| Vendor | Displays the vendor name of the wireless client. |
| Total WLANs | Displays the total number of WLANs managed by RF Domain member access points. |
| Top 5 | Displays the five RF Domain utilized WLANs with the highest average quality indices. |
| WLAN Name | Displays the WLAN Name for each of the Top 5 WLANs in the access point RF Domain. |
| SSID | Displays the SSID for the WLAN. |
| Max. User Rate | Displays the maximum recorded user rate in kbps. |
| Top 5 Radios | Displays five radios with the best average quality in the RF Domain. |
| Radio ID | Lists each radio‘s administrator defined hostname and its radio designation (radio 1, radio 2 or radio 3). |
| Radio Type | Displays the radio type as either 5 GHz or 2.4 GHz. |
| Top 5 Clients | Displays the five clients having the highest average quality indices. |
| Client MAC | Displays the client‘s hard coded MAC address used a hardware identifier. |
| Vendor | Lists each client‘s manufacturer. |
| RF Domain Threat Level | Indicates the threat from wireless clients trying to find network vulnerabilities within the RF Domain. The threat level is represented by an integer. |
| Rogue APs | Lists the number of unauthorized APs detected by RF Domain member devices. |
| WIPS Events | Lists the number of WIPS events generated by RF Domain member devices. |
| Total Bytes | Displays the total bytes of data transmitted and received within the RF Domain. |
| Total Packets | Lists the total number of data packets transmitted and received within the RF Domain. |
| User Data Rate | Lists the average user data rate within the RF Domain. |
| Bcast/Mcast Packets | Displays the total number of broadcast/multicast packets transmitted and received within the RF Domain. |
| Management Packets | Displays the total number of management packets processed within the RF Domain. |
| Tx Dropped Packets | Displays the total number of dropped data packets within the RF Domain. |
| Rx Errors | Displays the number of errors encountered during data transmission within the RF Domain. The higher the error rate, the less reliable the connection or data transfer. |
| Time Period | Lists the time period when Smart RF calibrations or adjustments were made to compensate for radio coverage holes or interference. |
| Power Changes | Displays the total number of radio transmit power changes that have been made using SMART RF within the RF Domain. |
| Channel Changes | Displays the total number of radio transmit channel changes that have been made using SMART RF within the RF Domain. |
| Coverage Changes | Displays the total number of radio coverage area changes that have been made using SMART RF within the RF Domain. |
 Print
this page
Print
this page Email this topic
 Feedback
 View PDF
 Download EPUB