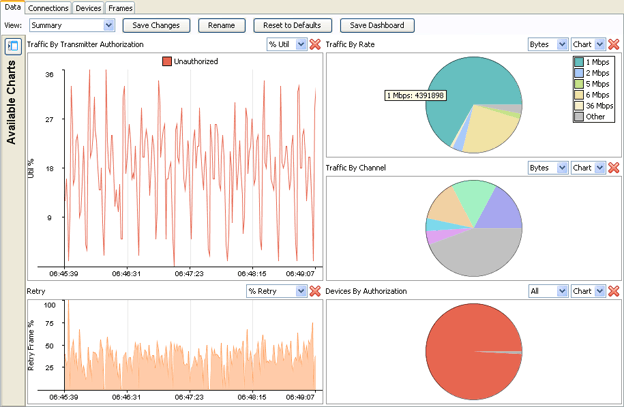
The Data tab provides a variety of charts that allows you to analyze different types of data transmitted and received to/from a particular device.
The Data tab focus can be changed by changing the view. Depending on the view that is selected different charts are displayed. There are four available views:
| View | Description |
|---|---|
|
Summary |
Provides a summary of frame data using the following charts:
This is the default view. |
|
Device Analysis |
Changes the frame data focus to device information. Charts relating to device information are displayed. |
|
Channel Analysis 2.4 Ghz (b/g/n) |
Changes the frame data focus to channel information for 802.11b/g/n network traffic. Charts relating to channel information are displayed. |
|
Channel Analysis 5 Ghz (a/n) |
Changes the frame data focus to channel information for 802.11a/n network traffic. Charts relating to channel information are displayed. |
Each view is customizable. You can add more charts to a view, rearrange the view, or remove charts from a view.
To add a chart to a view, click the View Available Charts
button  to
reveal the Available Charts.
to
reveal the Available Charts.
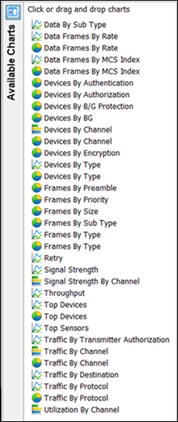 |
Once the Available Charts are revealed, you can drag and drop a
chart to the display area. You can display up to nine charts. To
view a chart temporarily, click on the chart name. It will display
superimposed over the current charts. Drop-down menus are available
to customize the view of the charts. To hide Available Charts,
click the Hide Available Charts
|
To rearrange a view, you can drag and drop charts to another location.
To remove a chart, click the Remove button  associated with the
chart.
associated with the
chart.
Once you have customized the display to fit your needs, click the Save Changes button to save your arrangement. The customized view is saved on your ADSP server. Now, whenever you access Live View, you can access your customized arrangement. This is true even if you are accessing the GUI on another workstation.
You can change the name of a view by clicking the Rename button. Just type in the new name and click OK. This allows you to give a view a more descriptive name if you changed the view significantly.
To return a view to the original factory default, click the Reset to Defaults button.
You can save a PDF file with a snapshot of the data charts by clicking the Dashboard button. A dialog window opens where you can name the PDF file and specify an author's name.
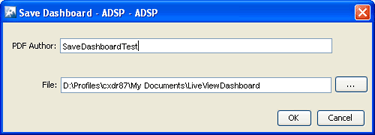
After supplying author's name and file name, click OK.
