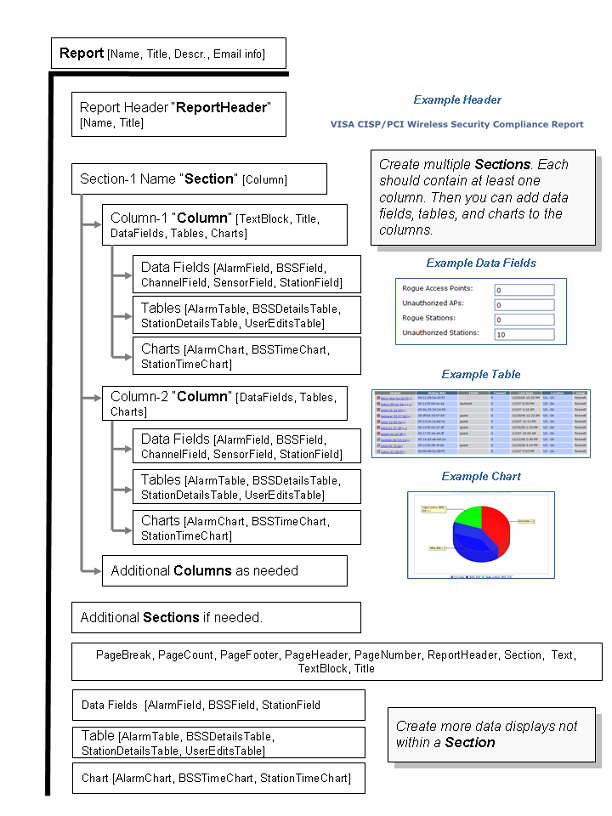
The following diagram shows the components, data fields, tables, and charts that are available for you to add at different points in the report tree.