The Category/Sub-Category widget displays the number of alarms raised for each alarm category or sub-category.
The Alarm Severity widget displays graphs of the number of alarms of different severity, generated in your network, as a bar graph and a pie chart.
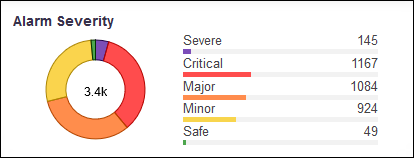
Click the Severity label to launch Alarms detail view with the data filtered for the Severity value.