The Network View is your main window into the Extreme AirDefense monitored network. This view provides various tools to drill down to the site/location of interest and view the state and statistics of the selected site/location in the screen's Details Pane.
Network Snapshot section - Use this section to have a quick insight into the state of your network.
Network Tree View section - Use this section to select the scope of the data to view in the Network View screen.
Details section - This section shows the data for the context (scope) selected in the Network Tree View section.
The Network Snapshot section of the screen provides a comprehensive insight into your network's state using widgets. For more information, see the topic Network Snapshot in this document.
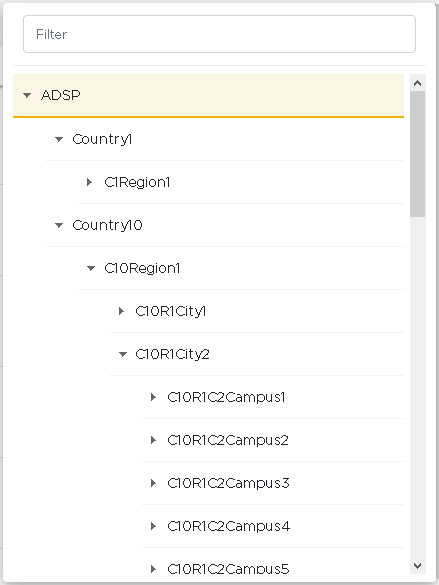
The Network Tree View section is a drop-down pane that you use to select the context or the scope of the data to display.
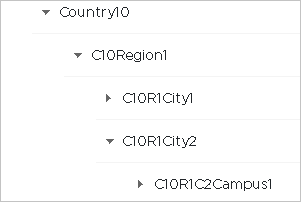
Use the ![]() icon before each tree node
to expand it and view its nodes. Similarly, use the
icon before each tree node
to expand it and view its nodes. Similarly, use the ![]() icon to collapse an expanded node.
icon to collapse an expanded node.
Select the node for which you want to view the details. On selecting the node, the Details View pane immediately starts loading with the appropriate information. Depending on the size of the data to display, the number of devices to load and your network connection, it might take sometime for the data to be displayed.
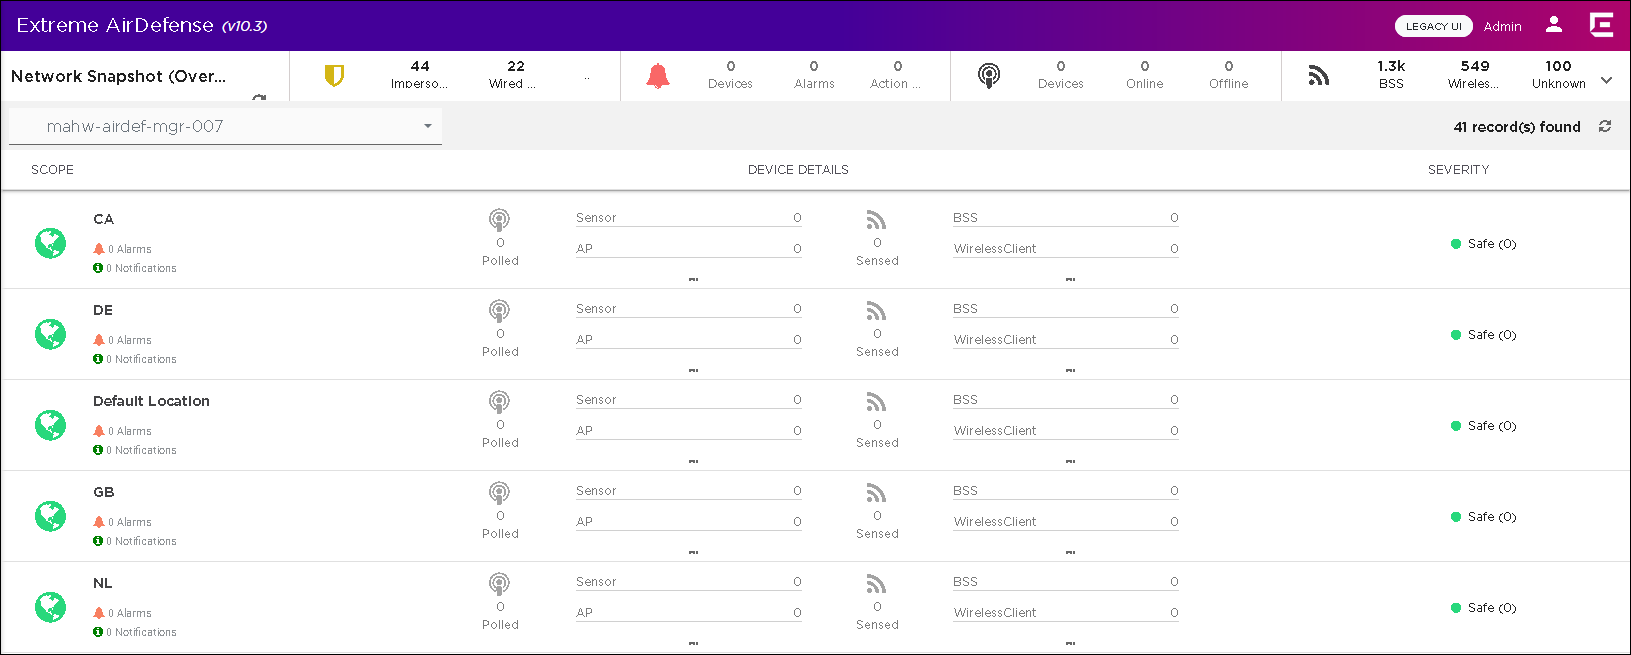
The Details view displays the current state of the selected site/location. This section also displays the total number of devices found at the site/location.

Note
You can configure the number of records to display using the Items per page control located at the bottom right of this screen. You can also use the navigation buttons located there to show more records.The following information is displayed:
|
Field |
Description |
|---|---|
|
Scope |
Identifies the scope of the data being displayed (location/site/floor). The scope depends on the selection made in the My Network Tree View. Click the site/location name to view detailed statistics for it. This link is only active if there is at least 1 alarm or notification for the site/location. 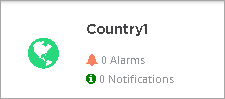 The Scope field displays the number of Alarms and Notifications generated for a site/location. The following icons indicate the severity of the site/location:
Select the Site Name in each row to navigate to the Device Details screen and to view details about the devices located in the selected site. If enabled, you can select the Alarms link, to launch the Alarms screen of this user interface to view the alarms raised in this site/location. For more information on the Device Details screen, see Network Pane - Details View. For more information on the Alarms screen, see Alarm View. |
|
Device Details |
This column displays statistics about devices identified by Extreme AirDefense Essentials in the network. Devices are broadly classified as Polled Devices and Sensed Devices. Polled Devices are those devices that are classified as Network Device in the main Extreme AirDefense Essentials user interface. Sensed Devices are those devices that are classified as BSS, Wireless Clients, BT/BLE, and Unknown Devices. Select the 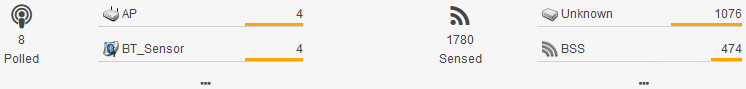 Hover on or near the 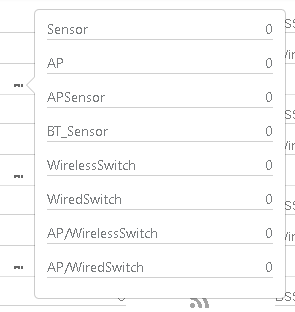 |
|
Severity |
Displays a graphical representation of the site/location's health along with the current Severity value. |
Occasionally, use the ![]() icon to refresh the data displayed in this
screen. Use the
icon to refresh the data displayed in this
screen. Use the  field to change the scope of the data
displayed on this screen.
field to change the scope of the data
displayed on this screen.
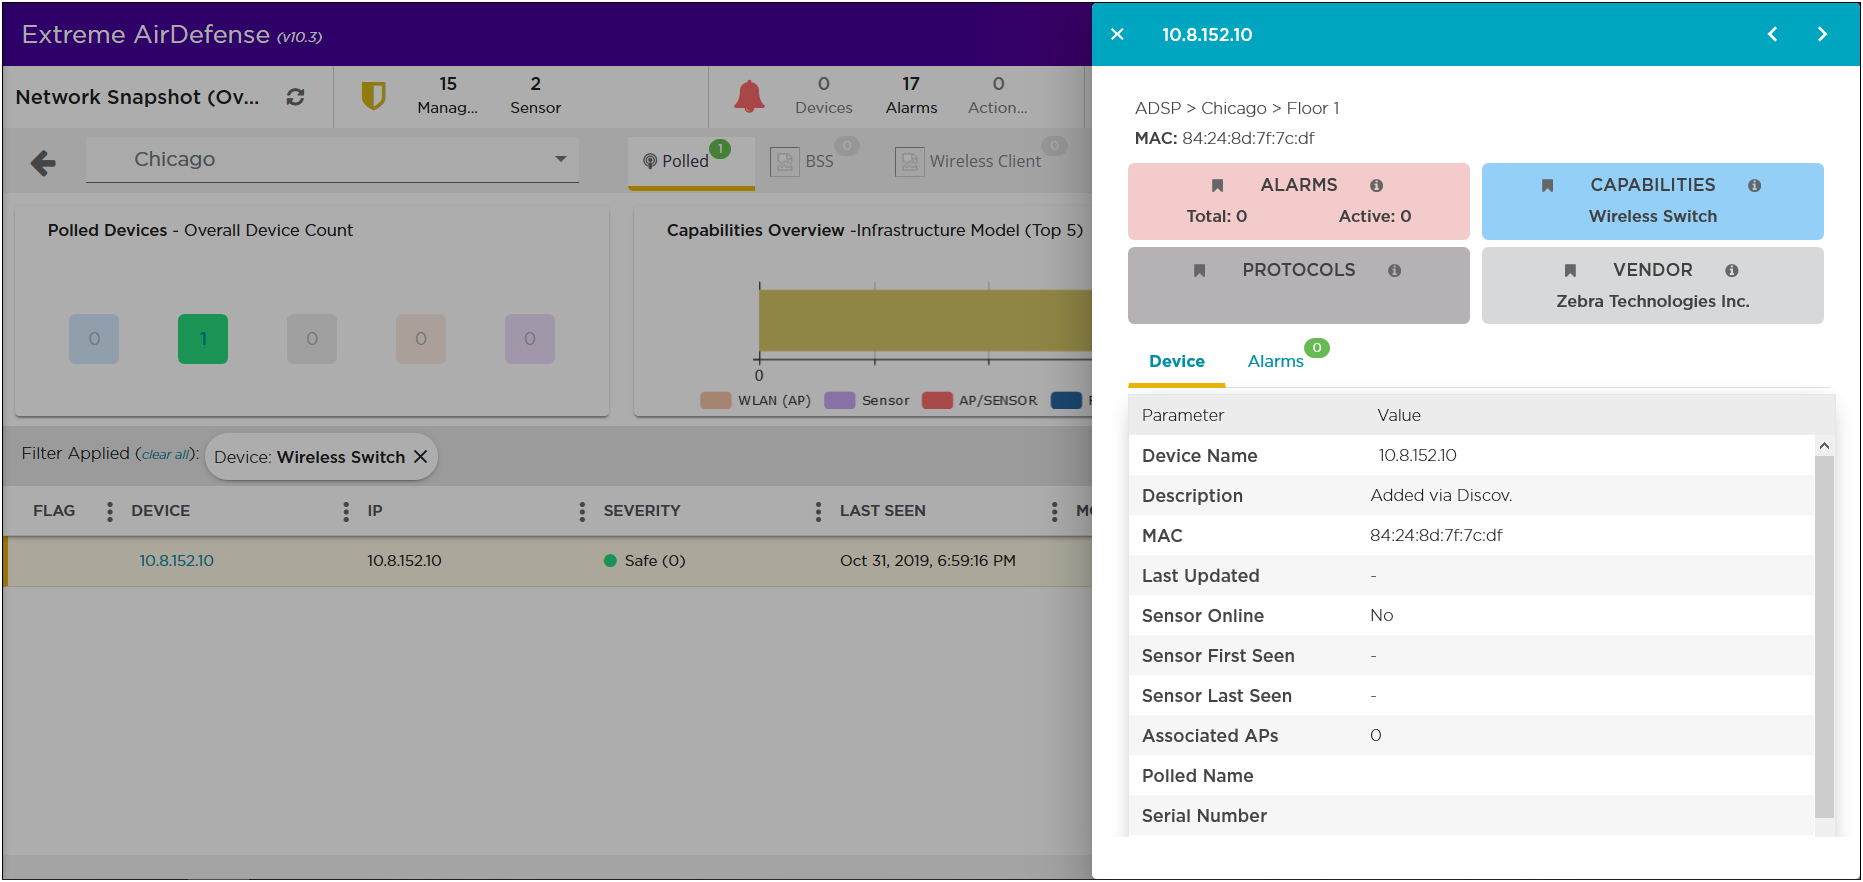
Click the Site Name under the Scope column to load the Device Details screen. This screen displays site specific information. When you select the Polled icon under the Device Details screen, the Device Details screen loads to display the Polled tab. When you select one of the device types, the Device Details screen loads with the data filtered for the selected device type.
This screen displays when you select a Site Name in the Details section of the Networks View screen. This screen displays a list of all the devices identified as being located at the site. Use this screen to quickly analyze your overall security and performance for the selected site. This screen also enables you to drill down and view detailed information on individual devices in your network. The following image displays a drill down view in the Network View window.