The Forensic RF tab visualizes forensic data to display coverage over a specific time range. Click the Forensic RF tab to display a historical heat map for signal coverage.
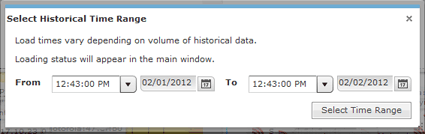
Specify a beginning time and date, specify an end time and date, and then click Select Time Range button.
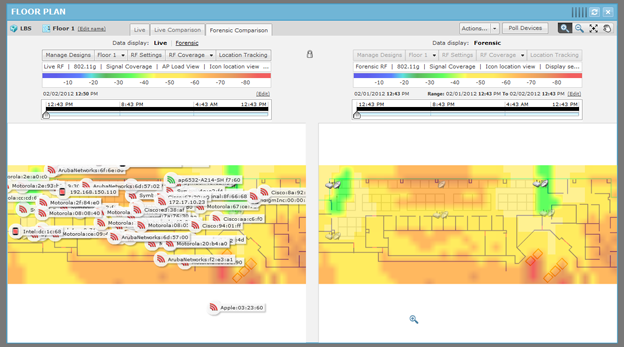
Two heat maps are displayed: one displaying Live RF for the current date and time, and one displaying Forensic RF for the specified time range. You can change the time range by clicking the Edit link and entering a new range. You can adjust the time range up or down within the specified range using the slider. Data points are displayed under the time line to indicate when changes occur. Move the slider to a data point to display the change in forensic data.