Advanced Spectrum Analysis (ASA) is the next generation of Spectrum Analysis. ASA has
four customizable views, each with its own set of default charts:
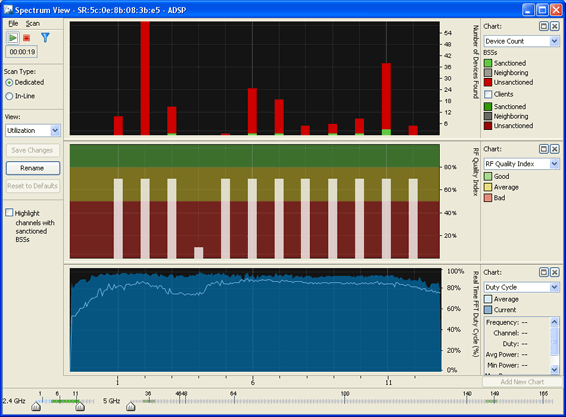
Utilization—Displays charts showing
how your network is being utilized. The default charts are:
Device Count
RF Quality Index
Duty Cycle.
Physical Layer—Displays charts that
highlight the physical layer of your network. The default charts are:
Spectrogram
Duty Cycle.
Interference—Displays charts showing
interference sources in your network. The default charts are:
Interference
Spectral Density.
Spectrum Detail—Displays charts
showing the spectrum details of your network. The default charts are:
Spectrogram
Real Time FFT (Fast Fourier
Transform)
Spectral Density.
Note
APs 7522 and 7532 do not support
Spectrum Analysis or Advanced Spectrum Analysis when running in RadioShare mode. When
the APs are configured as dedicated sensors, both SA and ASA are enabled and fully
functional.
The Advanced
Spectrum Analysis topic in Configuration chapter fully explains how to
confiure and use the Advanced Spectrum Analysis tool.