Use the Alarm View screen to manage your alarms from AirDefense. Alarm View screen is a single location from where you can see the alarms raised in your network. It provides various tools to drill down to the alarms and take appropriate actions on these alarms.
Alarms View can be divided into three sections, Alarms Summary, Network Tree View and Details panes. Use the Network Tree View pane to select the scope of the data to be display within the Alarms View pane. The Details pane displays alarms for the context(scope) selected in the Network Tree View pane.
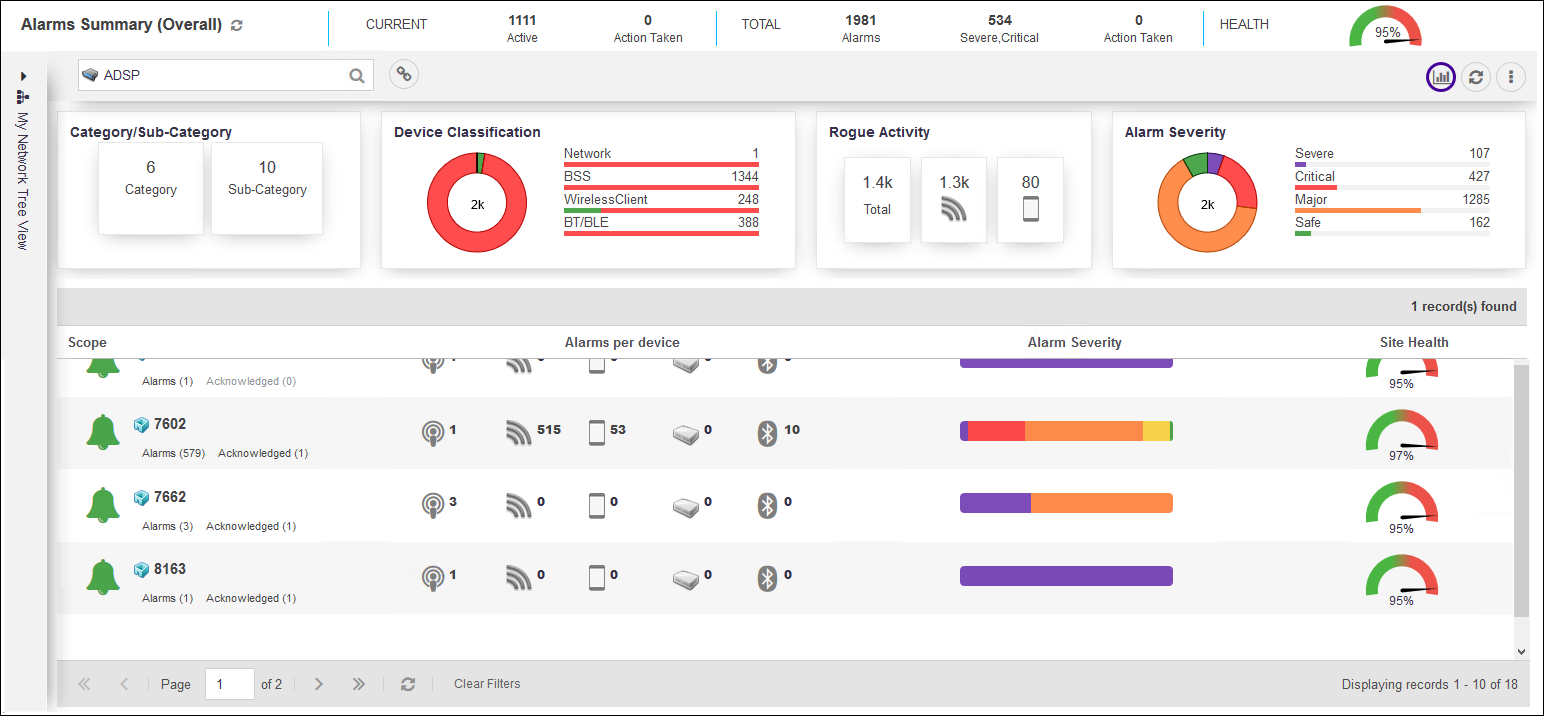
The Alarms Summary pane lists a count of all alarms generated in the network and also the overall health of the AirDefense monitored network. For more information, see Alarms Summary.
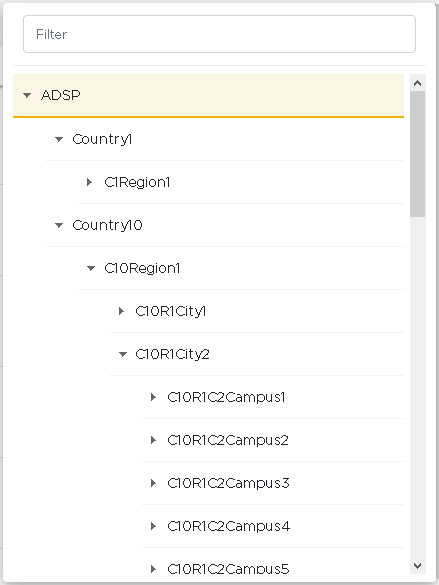
The Network Tree View section is a drop-down pane that you use to select the context or the scope of the data to display.
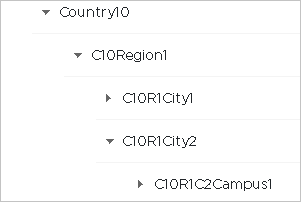
Use the ![]() icon before each tree node
to expand it and view its nodes. Similarly, use the
icon before each tree node
to expand it and view its nodes. Similarly, use the ![]() icon to collapse an expanded node.
icon to collapse an expanded node.
Select the node for which you want to view the details. On selecting the node, the Details View pane immediately starts loading with the appropriate information. Depending on the size of the data to display, the number of devices to load and your network connection, it might take sometime for the data to be displayed.
The Details View pane displays a list of alarms generated for the selected site/location. The following information is displayed:
|
Column |
Description |
|---|---|
|
Scope |
This column displays the name of the site/location for which the alarm information is generated. Select the site/location name to launch the Alarm Details screen to view the alarms for the site. This option is only available for a site that has at least one alarm or notification indicated for it. For more information, see Alarms - Details View. |
|
Alarm per Device |
This column displays the count of alarms generated by each device category. 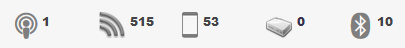 The icons represent these device categories:
|
|
Alarm Severity |
This column indicates the severity level of the alarms for this site/location as a bar graph. The graph color codes each severity type.  Hover on each of the color bars to view the number of alarms generated for this site/location for the selected alarm level. Select a color on this bar graph to filter and view the alarms of the selected severity. The filtered alarms are displayed in Alarm Details screen. |
|
Site Health |
This column indicates a calculated value that indicates the site's health and displayed on a graph. Site health is calculated using the threat index of each alarm raised in the site and includes the alarms from all the floors in the site. When calculating Site Health, the threat index of the topmost alarms in the site are used. For example, for a site where alarms of the categories Severe, Critical, Minor are present, only the threat indexes of all alarms of Severe category are considered for calculating the Site Health. Other alarms are ignored. When you acknowledge an alarm, the threat index of that alarm is not included when calculating the Site Health in the next iteration of Site Health calculation. |
The Toolbar enables you to perform specific tasks quickly.

The following actions can be performed from the Alarms toolbar.
|
Tool |
Description |
|---|---|
|
|
Use this field to select the scope of the data to display in this screen. |

|
Select this icon to view or hide the Grid Chart view in this pane. |

|
Periodically use this Refresh icon to refresh the data displayed on this screen. |

|
Select this icon to view a list of alarms that were raised in the last one hour. |
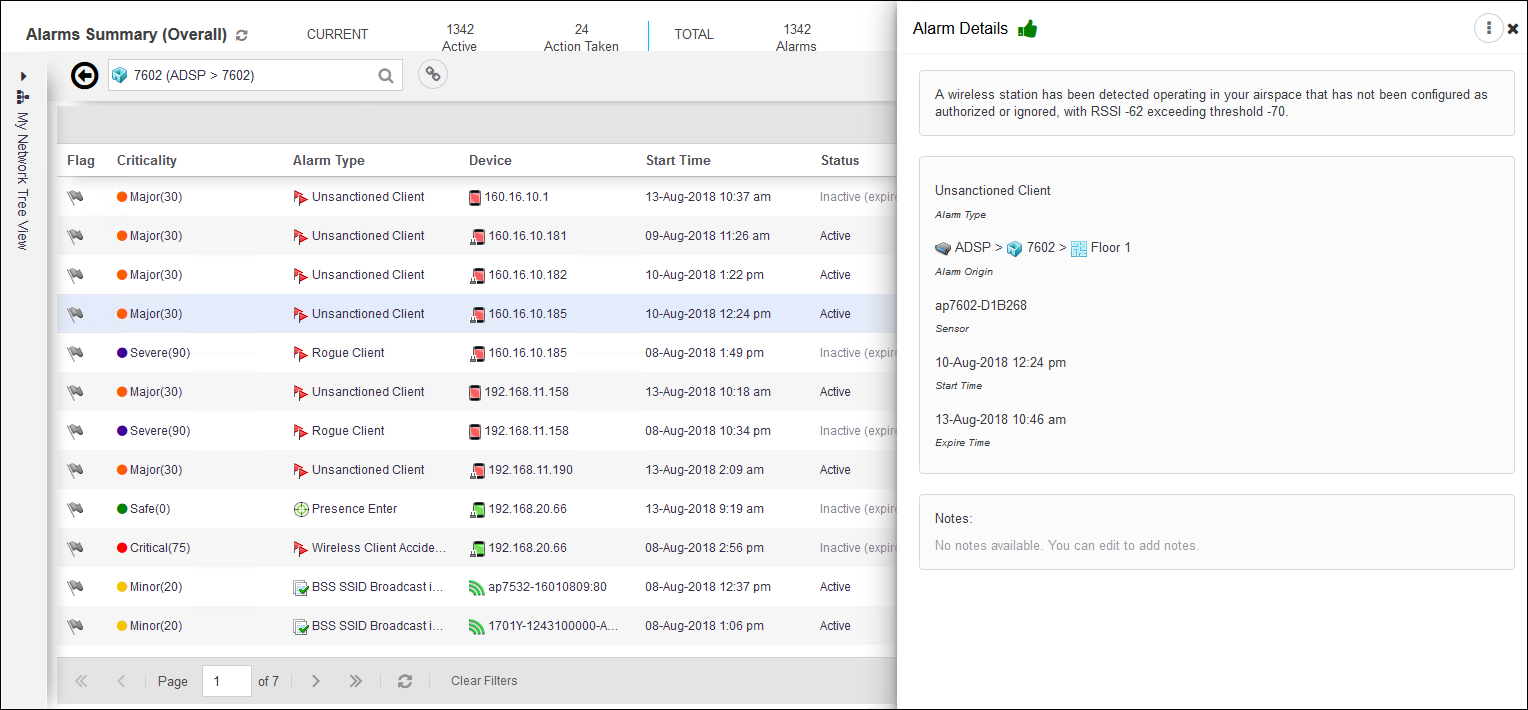
The Alarm View lets you drill down quickly to analyze alarms and other issues in your network. It enables you to view detailed information about the alarms and issues seen in your network. The following image displays a drill down view in the Alarms View window.
Select the Alarm Type field for each alarm to view its details.