The Context Label, located near the top-center of the Floor Plan, controls the context of the Floor Plan.
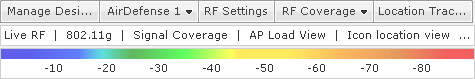
The Context Label shows you the following information:
| Field | Description |
|---|---|
|
Manage Designs |
When this field is clicked, a list of existing designs is
displayed:
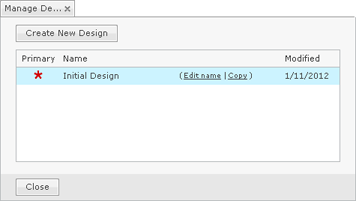 You can edit or add to the list using the following actions:
Click Close to exit the design manager. |
|
Floor Selection |
This field shows the selected floor. If you click the field, you
can select another floor to view.
 |
|
RF Settings |
RF Settings includes:
|
|
RF Mode Setting |
The RF Mode setting determines if your heat maps display no RF
data (deselected), Live RF data (selected), or Predicted RF data
(selected).
 |
|
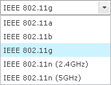
Protocol Setting |
The Protocol setting allows you to filter RF data according to
the selected protocol.
 |
|
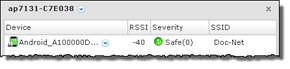
AP Load View Setting |
The AP Load View setting, when selected, displays a circle around
any AP that has Wireless Clients associated with it. Layered on
the circle is a smaller circle displaying the number of
associated Wireless Clients.
 Click on the smaller circle to display all the associated
Wireless Clients in a table.
 |
|
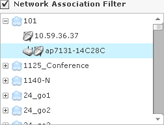
Network Association Filter Setting |
The Network Association Filter is where the network device
association is shown in a network tree. You may select an entire
SSID or individual devices.
 |
|
RF Coverage |
This field lets you select the coverage visualization or
application coverage for your heat maps. If you click the field,
you can select another visualization or application.
 Visualizations and applications are configured in . |
|
Location Tracking |
This field displays a list of devices being tracked grouped by
device type.
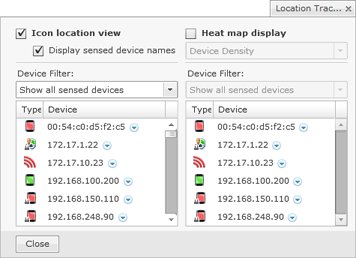 If a device in the list is selected (highlighted) it is highlighted in the floor plan map. Location Tracking has two views: Icon location view and Heat map display. The Icon location view displays the most likely location for selected devices as an icon for each device. The Heat map display displays the most likely locations for the selected device as a color gradient ranging from red (most likely) to blue (least likely) locations. |
|
Current Settings |
This field gives you a quick view of the settings that have been
set via the Context Label.
 Three dots (...) at the end of the Current Settings indicate
there are more settings that have been configured. Moving your
mouse over the Current Settings will reveal the additional
settings.
 |
|
Color Chart |
The color chart is a legend representing the signals displayed as
RF data in the Floor Plan. Each color represents a signal
strength (in dBm).
 |