Alarm Details List is a table that displays details for each alarm generated in a site/location.
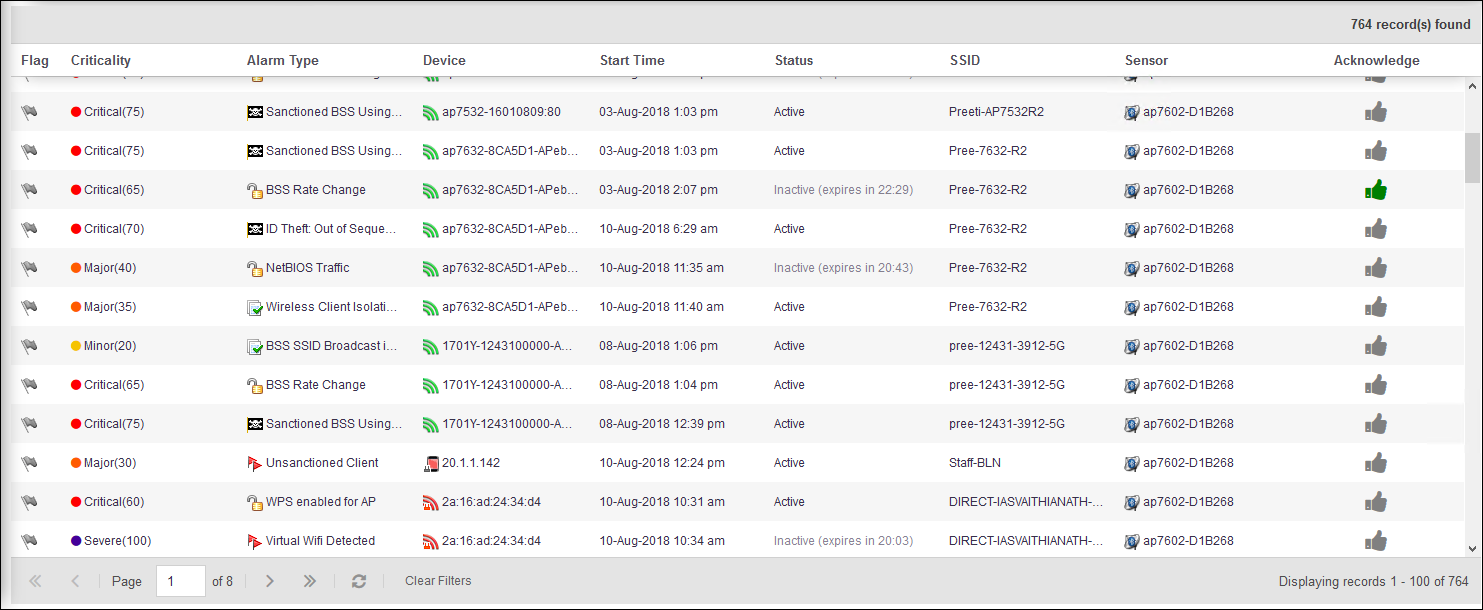
The following information is displayed:
|
Column |
Description |
|---|---|
|
Flag |
Select the |
|
Criticality |
This column displays the criticality value of the alarm. Criticality is a numerical value that indicates how critical the alarm is. The higher the value, the more critical the alarm. Each alarm has a numerical value (criticality index) pre-assigned to it. This value is used when calculating the Site Health for the site/location/system. |
|
Alarm Type |
This column displays the type of alarm generated. Each alarm is assigned a threat or criticality index. This index value is displayed in the Criticality column. |
|
Device |
This column displays the device type icon and its name. Hover on the name to display more details about the device in a pop-up. The following image is a pop up that displays on hover. The information that the pop-up displays is different for the different device types. The following image is of a pop-up displaying data for a polled device. 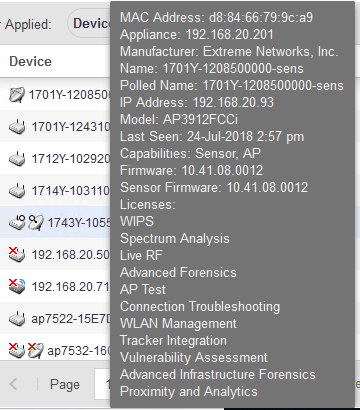 |
|
Start Time |
This column displays the time and date when the alarm started. |
|
Status |
This column displays the status of the alarm. Alarms are either active or inactive. Active alarms can either be acknowledged or not acknowledged. Inactive alarms are displayed till they expire after a configured time duration. |
|
SSID |
This column displays the SSID of the network to which the device -that generated this alarm- is adopted to. |
|
Sensor |
This column displays the name of the sensor that observed the device that generated this alarm. |
|
Acknowledge |
Use this column to mark the alarm as Acknowledged. This indicates that you have selected the alarm and viewed the alarm's details. Acknowledged alarms are not used when calculating a site's Site Health. |
By default, only few columns are displayed in the table. Depending on the context, additional fields can be manually added to the table.
To add/remove table columns,
select the ![]() icon to
the left of any column header. The following drop-down list
displays.
icon to
the left of any column header. The following drop-down list
displays.
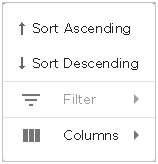
Select the Filter item to filter your data. This option might not be available for all screens. When this option is available, use the available filter criteria to filter the data displayed in the screen.
Select the Columns item to view a list of columns that can be added to the table.
The following table lists the additional columns that can be added to the table.
|
Column |
Description |
|---|---|
|
Alarm ID |
This column displays the unique ID assigned to this alarm when it was generated. This ID can be used to query for specific alarms. |
|
Expire Time |
Displays the date and time when the alarm expires. In case of inactive alarms, this field displays the time the alarm will be purged from the system. |
|
Signal Strength |
This column displays the signal strength of the device that triggered this alarm. |
|
Channel |
This column displays the channel and the frequency on which this device, that triggered the alarm, was identified. |
|
Notes |
This column displays the notes made for this alarm. |
|
Summary |
This column displays a brief description of the alarm. |
The following actions can be performed on the alarms listed in the table. Select the
![]() icon from the toolbar to display the list of actions that can be
performed.
icon from the toolbar to display the list of actions that can be
performed.
|
Column |
Description |
|---|---|
|
Clear Alarm |
Use this menu item to clear the alarm. When cleared, the alarm is removed from this list. You can also temporarily clear the alarm for the duration of 1 Hour, 6 Hours, 12 Hours, or 24 Hours. Once this duration expires, the alarm is added back to this list if the conditions that generated this alarm are not cleared. |
|
Edit Alarm Notes |
Use this menu item to add more details in a note that is attached to the alarm. When selected, a dialog is displayed where you can add your notes. |
|
Set Flag |
Use this menu to set a flag for this alarm. Flags are used to
indicate that the alarm requires attention. When an flag is set,
it changes to |
|
Remove Flag |
Use this menu to unset or remove a flag set for an alarm. When
unset, the flag icon changes to |
|
Mark as New |
Use this menu to mark an alarm as new. When marked, the alarm is indicated in bold. |
|
Mark as Acknowledged |
Use this menu to mark the alarm as Acknowledged. This indicates that you have selected the alarm and viewed the alarm's details. Acknowledged alarms are not used when calculating a site's Site Health. |
|
Export Alarms |
Use this menu to export the alarms as a Comma Separated Value (csv) file. When prompted, provide the name and place to save the file. |
|
Manage Cleared Alarms |
Use this menu to manage alarms that you have cleared or selected to remain cleared for a set period. Use the screen to reset these cleared alarms. |

