This widget displays a graph that displays the hourly trend of all wireless clients seen in the network in the last three(3) days.
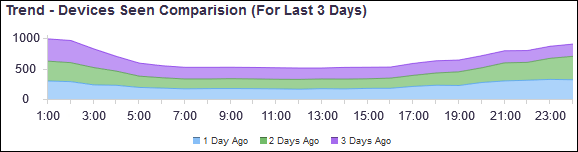
Click on a label to include or exclude its data in the widget. When the data for the label is excluded, the label is displayed in a lighter color.